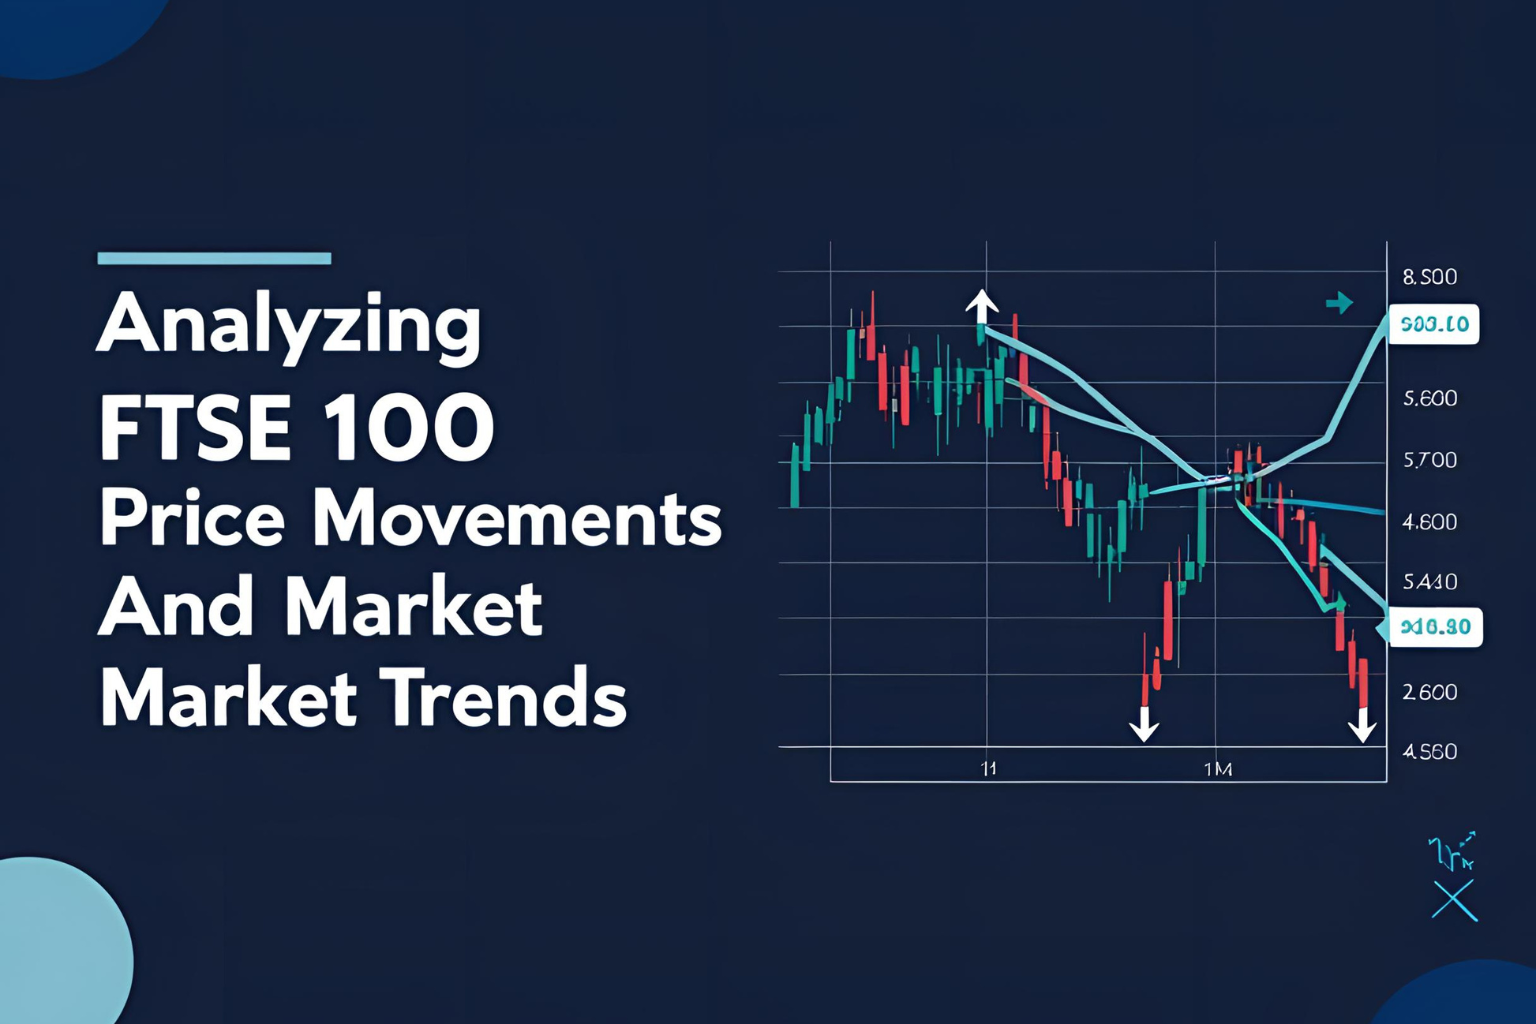
Analyzing FTSE 100 Price Movements and Market Trends
Introduction:
The FTSE 100 Index reflects the combined performance of the UK’s top 100 companies. But why does the index rise one day and fall the next? In this article, we’ll break down what causes FTSE 100 price movements and how to analyze market trends like a pro—even if you’re just starting out.
What Drives FTSE 100 Price Movements?
FTSE 100 prices are affected by both company-specific news and macroeconomic factors. Here are the most common influences:
1. Corporate Earnings
Quarterly results, profit warnings, or upgrades from major FTSE 100 companies can shift the index, especially if it’s a top-weighted stock like Shell or HSBC.
2. Global Events
News such as geopolitical tension, oil price changes, or global economic reports often move UK markets—even if the events are abroad.
3. UK Economic Data
- Inflation reports
- Bank of England interest rate decisions
- GDP figures
All can affect market sentiment and investor behavior.
4. Currency Movements
A weaker pound (£) often boosts FTSE 100 prices, since many FTSE companies earn revenue in foreign currencies. Conversely, a stronger pound may drag the index.
5. Sector-Specific News
If oil prices jump, energy stocks like BP and Shell may lift the index. Bad news in banking or healthcare can pull it down.
Short-Term vs Long-Term Trends
- Short-term movements are usually influenced by news, data releases, and daily sentiment.
- Long-term trends depend on economic cycles, sector shifts, and policy changes.
Investors often use moving averages (like the 50-day or 200-day) to identify whether the index is in an uptrend or downtrend.
How to Analyze Market Trends
- Use FTSE 100 Charts
- Look at daily, weekly, and monthly timeframes.
- Identify support/resistance levels and breakout zones.
- Watch Volume
- Higher trading volume can confirm strong trends.
- Low volume may indicate weak or false movements.
- Read Market News
- Follow outlets like Bloomberg, Financial Times, and Reuters for FTSE-specific updates.
- Compare Sector Performance
- Sector rotation can signal where capital is flowing.
- Tools like TradingView or Investing.com help track this.
Tools for FTSE 100 Trend Analysis
- TradingView – Live charts and indicators
- Yahoo Finance – Price history and news
- Google Finance – Quick look at intraday changes
- LSE.co.uk – Company news and press releases
Conclusion
Understanding FTSE 100 price movements is key to becoming a more informed investor. From global headlines to UK inflation data, many factors come into play. By learning to read charts, track trends, and monitor key drivers, you’ll be well-positioned to make smarter decisions in the UK stock market.
FAQs
1. What causes the FTSE 100 to rise or fall daily?
Company earnings, economic data, global events, and currency fluctuations all impact the index.
2. Does the FTSE 100 only reflect the UK economy?
Not entirely. Many FTSE 100 firms are global, so the index responds to both UK and international developments.
3. Is technical analysis useful for FTSE 100 trading?
Yes. Many traders use moving averages, RSI, and trendlines to analyze FTSE 100 price trends.
4. How can I follow FTSE 100 trends daily?
Use platforms like Yahoo Finance, TradingView, or news feeds from Bloomberg or Reuters.
5. Do currency changes affect FTSE 100 prices?
Yes. A weaker GBP often boosts FTSE 100 as many firms earn income in foreign currencies.


