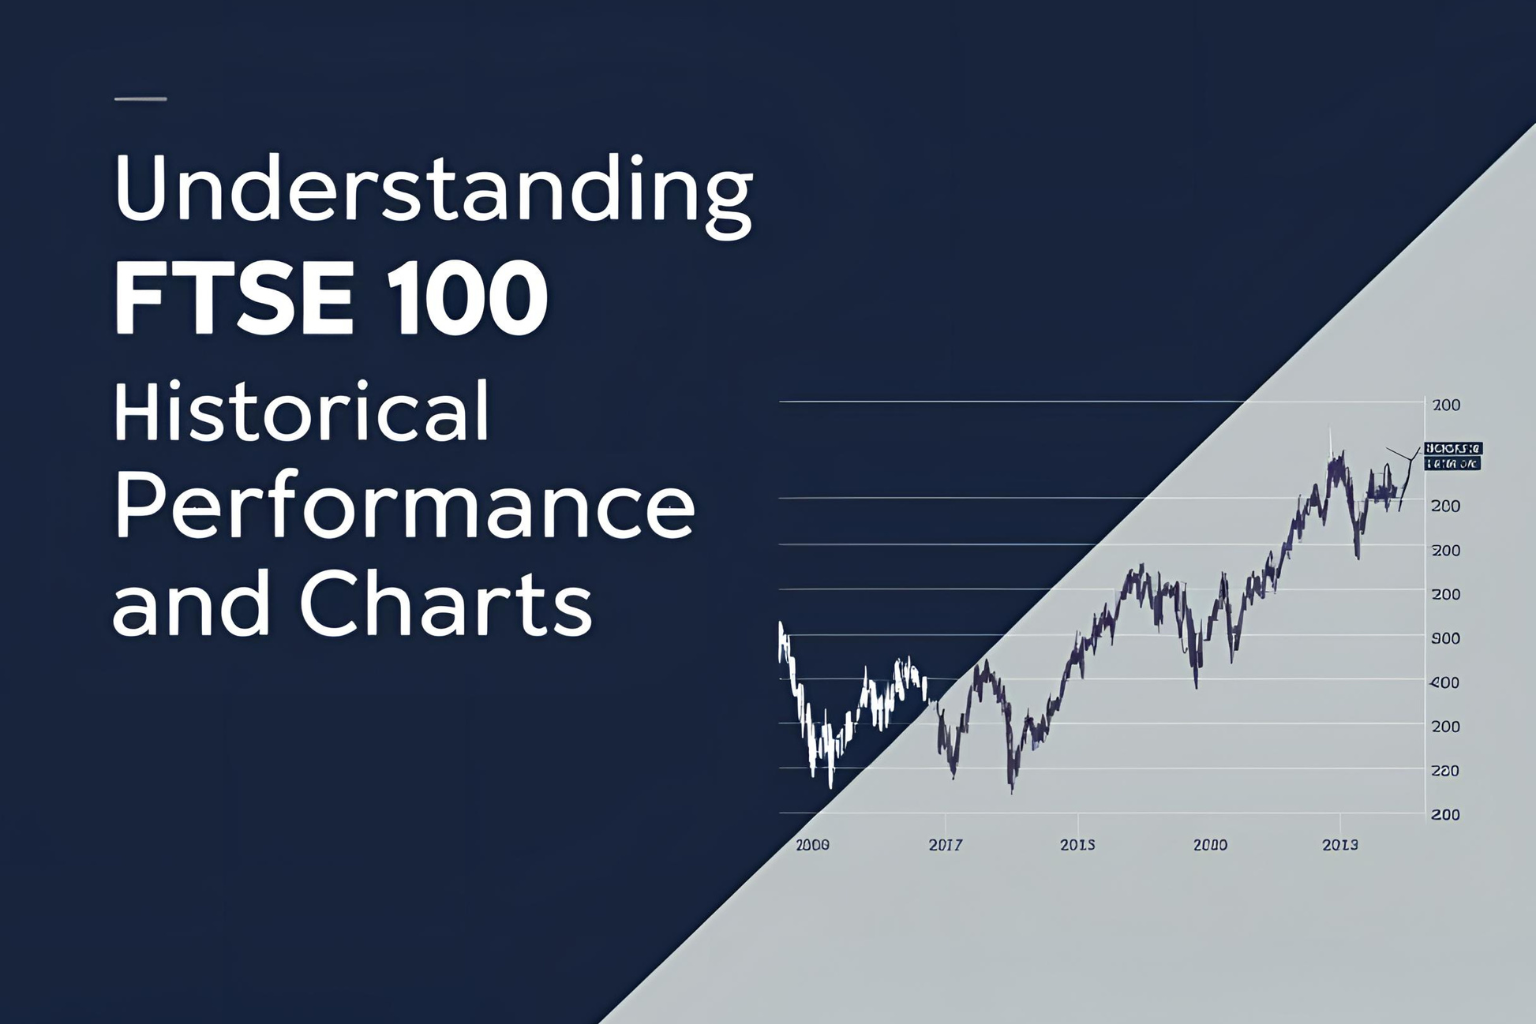
Understanding FTSE 100 Historical Performance and Charts
Introduction:
Looking at the historical performance of the FTSE 100 can offer valuable insights into how the UK stock market has evolved over time. It helps investors and analysts recognize long-term trends, identify market cycles, and make better-informed decisions. In this post, you’ll learn how the FTSE 100 has performed over the years and how to read its price charts effectively.
Why Historical Performance Matters
Historical data lets you:
- Evaluate how the FTSE 100 responded to past economic events (e.g. financial crises, political changes).
- Measure average annual returns over time.
- Compare past performance with other global indices like the S&P 500 or FTSE 250.
- Assess long-term growth vs short-term volatility.
FTSE 100 Performance Over the Years
The FTSE 100 was launched in 1984 with a base level of 1,000 points. Since then, the index has experienced:
- Steady growth in the 1990s during the tech boom.
- A sharp fall during the 2008 financial crisis.
- Recovery and new highs in the 2010s.
- Volatility due to Brexit (2016) and the COVID-19 pandemic (2020).
- A rebound post-2020, driven by strong performance from sectors like energy and mining.
As of 2025, the FTSE 100 typically fluctuates between 7,000 to 8,000 points, though this range depends on macroeconomic conditions.
How to Read FTSE 100 Charts
FTSE 100 charts help visualize price movement. Here’s how to understand them:
1. Chart Types:
- Line Chart: Plots closing prices over time. Simple and clean.
- Bar Chart: Shows opening, closing, high, and low prices per period.
- Candlestick Chart: Offers detailed info and is widely used by traders.
2. Timeframes:
- Daily: Ideal for short-term trends.
- Weekly/Monthly: Better for long-term investors to spot overall direction.
3. Key Elements to Watch:
- Trend direction (uptrend or downtrend)
- Support and resistance levels
- Moving averages (e.g., 50-day, 200-day)
- Volume indicators (to confirm strength of a move)
Where to Find FTSE 100 Historical Charts
You can access historical FTSE 100 charts from:
- Yahoo Finance
- TradingView
- Investing.com
- Official FTSE Russell site
Look for features like:
- Downloadable historical data (daily, weekly, monthly)
- Customizable chart periods
- Technical analysis tools
Conclusion
Understanding the FTSE 100’s historical performance and chart movements is essential for both beginner and seasoned investors. Charts help you track past behavior, identify trends, and plan better investment strategies. While history doesn’t guarantee future results, it often provides useful guidance.
FAQs
1. What is the all-time high of the FTSE 100?
The FTSE 100 reached its all-time high above 8,000 points in early 2023. However, prices vary due to market conditions.
2. How far back does FTSE 100 historical data go?
You can find FTSE 100 data dating back to its launch in 1984, with many chart platforms offering full archives.
3. What events caused major FTSE 100 declines?
Significant drops occurred during the 2008 financial crisis, the 2016 Brexit vote, and the 2020 COVID-19 crash.
4. How accurate are FTSE 100 charts?
Most platforms pull real data from exchanges, making charts highly reliable for analysis.
5. Can I download FTSE 100 historical data?
Yes, websites like Yahoo Finance or Investing.com allow you to export CSV files with daily, weekly, or monthly prices.


