
FTSE 100 Chart Patterns: Technical Analysis Basics
Introduction:
Chart patterns are one of the core tools in technical analysis, helping traders and investors identify market trends, reversals, and key entry points. In this article, we’ll explore the most common FTSE 100 chart patterns, explain how to read them, and show how they can support your investment decisions—even if you’re just starting out.
What Are Chart Patterns?
Chart patterns are visual formations created by price movements on a chart over time. Traders use them to:
- Predict future price direction
- Identify buying or selling opportunities
- Confirm trend continuation or reversal
Patterns can appear on any time frame—daily, weekly, or monthly—and are especially useful when analyzing an index like the FTSE 100.
Common FTSE 100 Chart Patterns
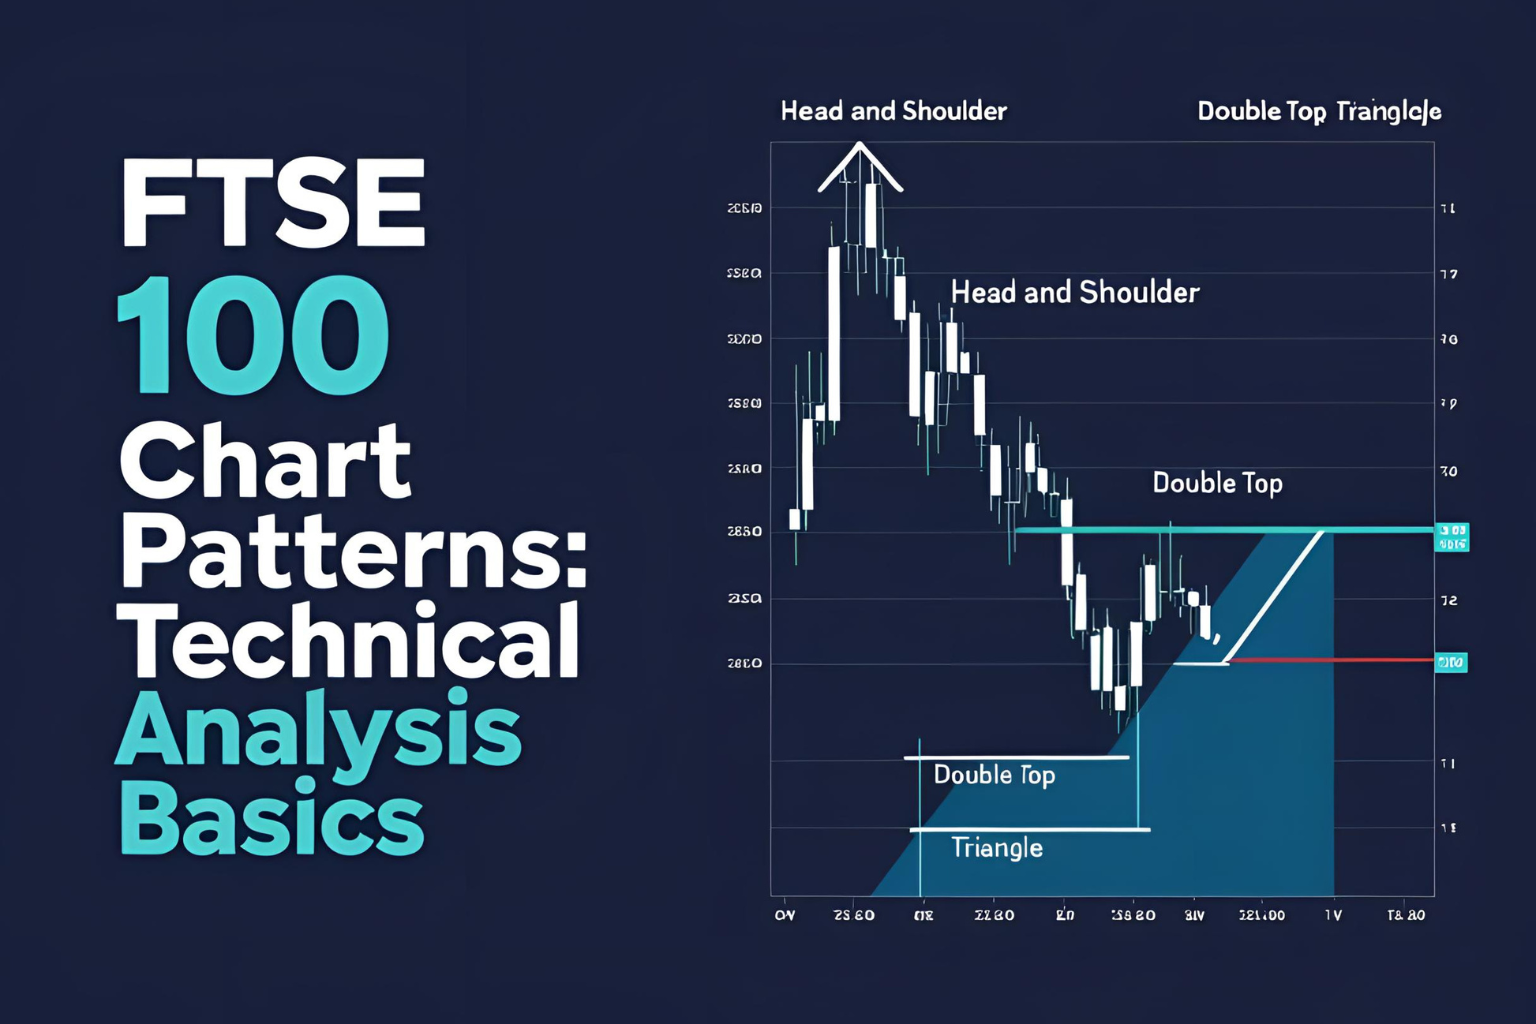
1. Head and Shoulders
- Type: Reversal
- Meaning: Signals a trend reversal (bullish to bearish or vice versa)
- Example: Appears at the top of a rising market or bottom of a falling market
2. Double Top / Double Bottom
- Type: Reversal
- Meaning: A strong signal of trend reversal after two failed breakouts in the same direction
3. Triangles (Ascending, Descending, Symmetrical)
- Type: Continuation or reversal
- Meaning: Price consolidates before a breakout; useful for anticipating volatility
4. Flags and Pennants
- Type: Continuation
- Meaning: Short-term pause in a trend before resuming movement in the same direction
5. Cup and Handle
- Type: Bullish continuation
- Meaning: Rounded bottom followed by a short pullback and then a breakout
How to Use These Patterns
- Look for confirmation: Wait for breakout or breakdown before acting.
- Combine with volume: Patterns are stronger when confirmed by rising volume.
- Set stop-loss and target levels: Use the pattern structure to define your risk/reward.
FTSE 100 Example
On a daily FTSE 100 chart, if you spot a symmetrical triangle, it may signal upcoming volatility. If the breakout happens on higher volume, traders may expect a short-term rally or correction.
Use tools like:
- TradingView
- Investing.com
- Yahoo Finance Charts
These platforms offer easy access to live and historical FTSE 100 charts.
Benefits of Using Chart Patterns
- Helps identify trends early
- Supports technical entry/exit decisions
- Complements fundamental analysis
- Works across different timeframes
Conclusion
Understanding FTSE 100 chart patterns gives investors an extra edge in spotting market signals. Whether you’re analyzing trends or planning trades, recognizing these patterns can boost your confidence and improve decision-making. Start with the basics, and practice spotting them on real FTSE 100 charts.
FAQs
1. Do chart patterns work for indices like the FTSE 100?
Yes. Though primarily used in stock trading, chart patterns can also apply to indices and ETFs.
2. What time frame is best for FTSE 100 technical analysis?
Daily and weekly charts are commonly used for swing and long-term analysis.
3. Are chart patterns reliable?
They provide probabilities, not guarantees. Always confirm with volume and other indicators.
4. What tools can help me analyze FTSE 100 charts?
Free tools like TradingView, Yahoo Finance, or Investing.com are great starting points.
5. Can beginners use chart patterns?
Absolutely. Start with basic patterns like triangles and double tops to build your skills.

